Accessibility Infographics

Class project, GDES 420

Objective: Create a series of infographics to highlight key data on web accessibility and its importance.

Deliverables: Infographic series in png format

Process: Researched accessibility issues, found relevant data, conceptualized information design, created decorative illustrations

Tools: Adobe Illustrator

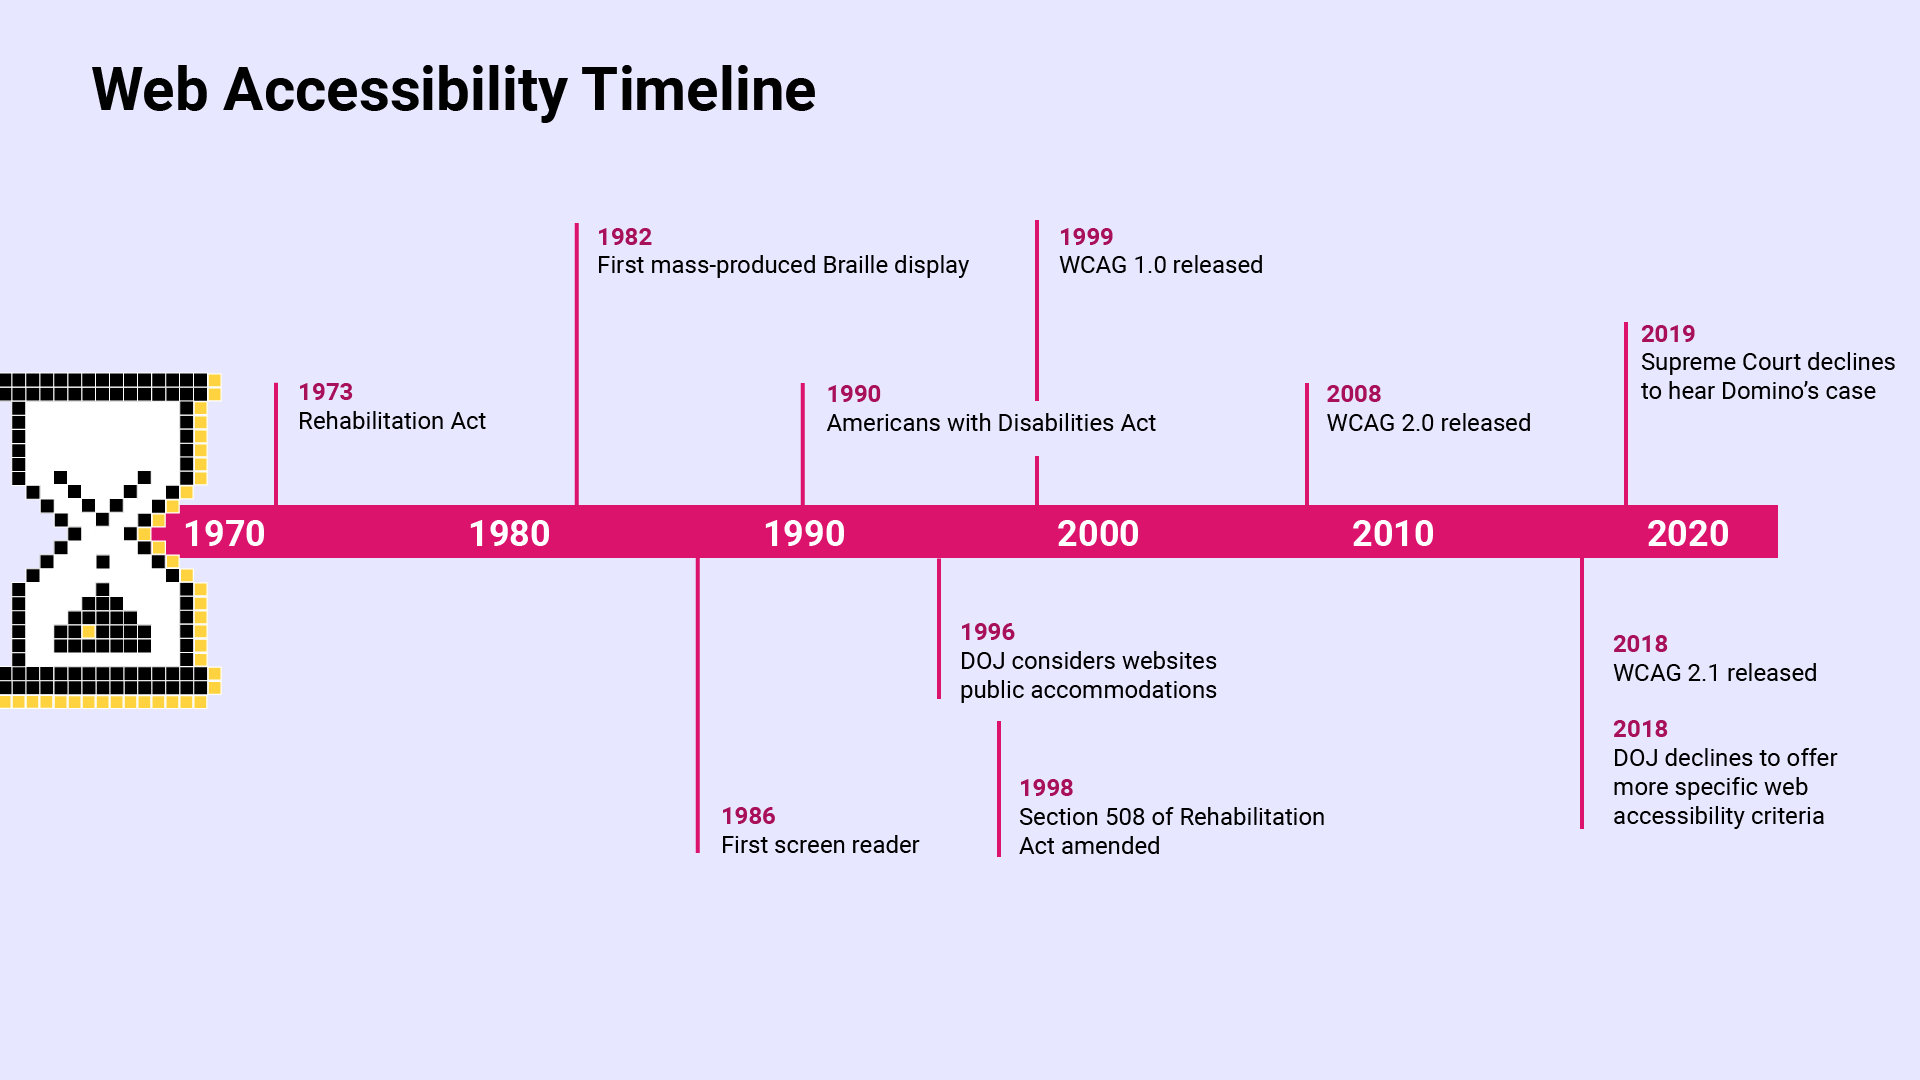
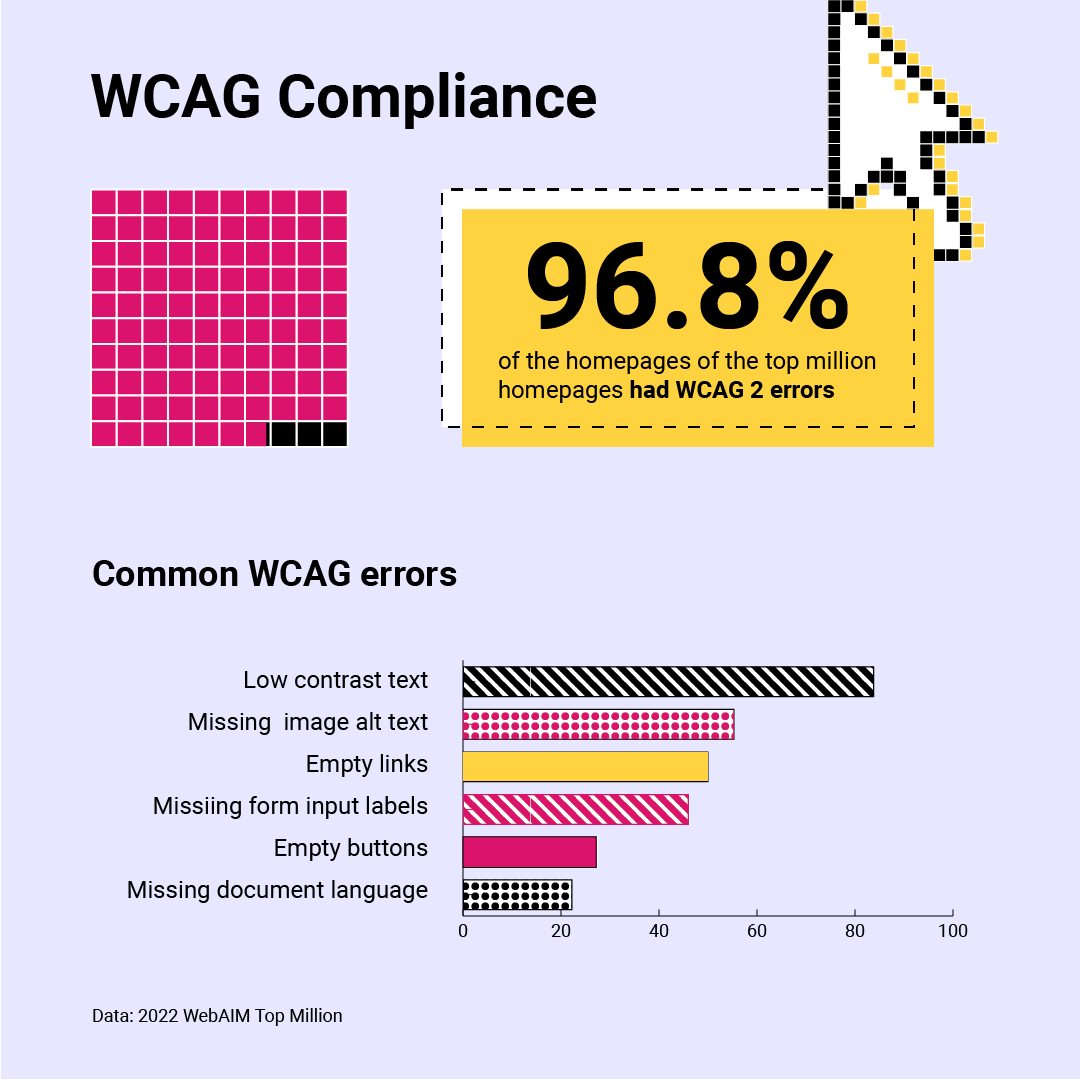
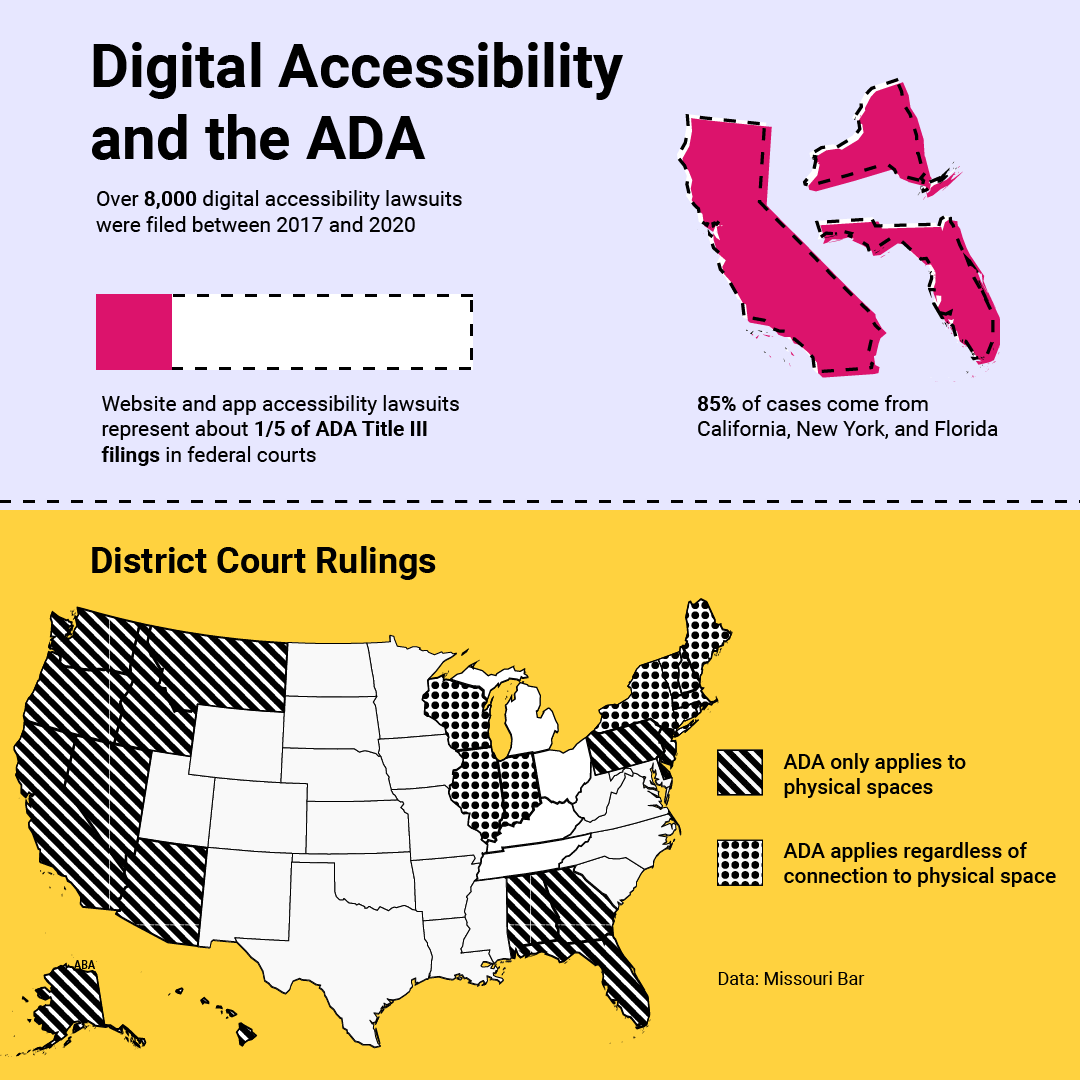
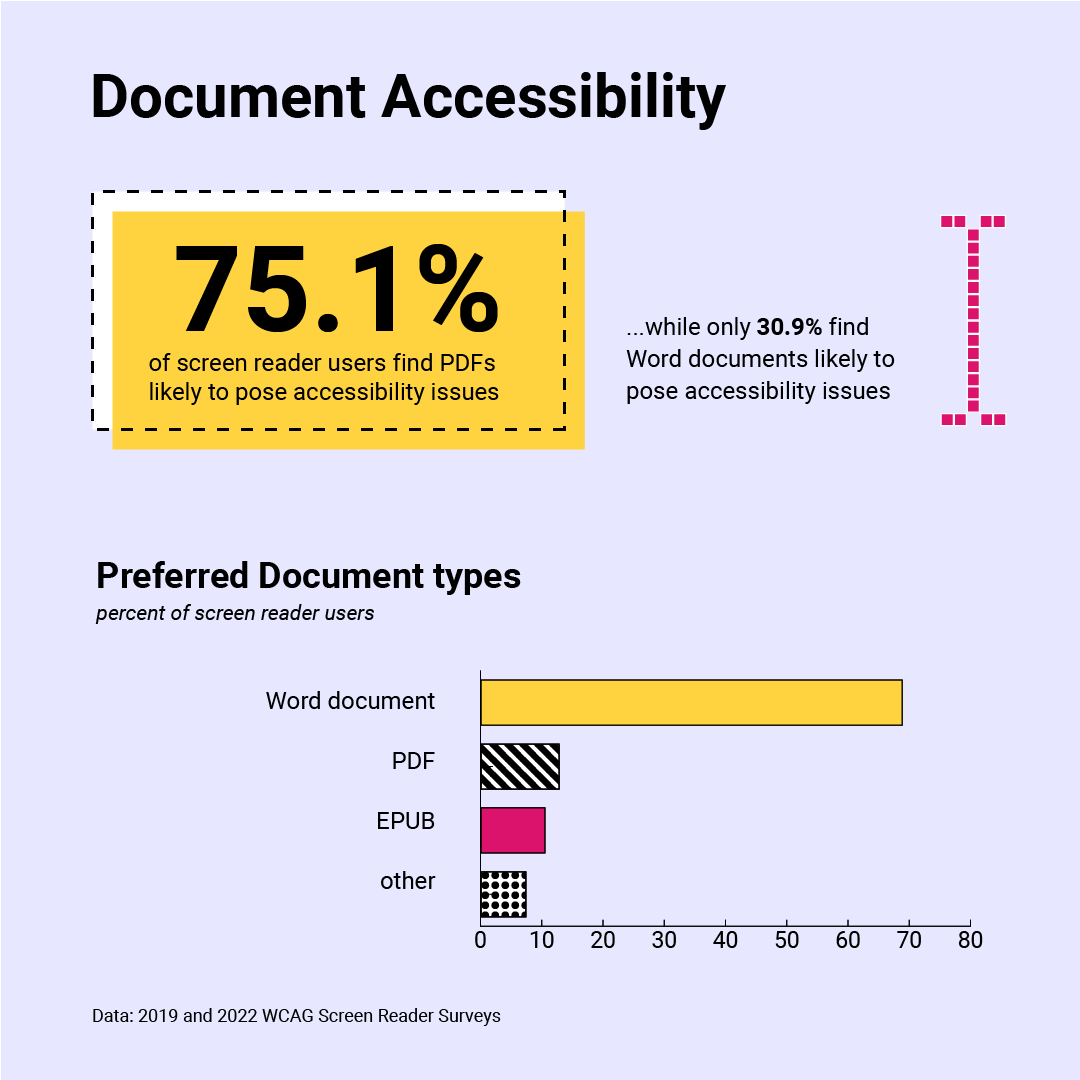
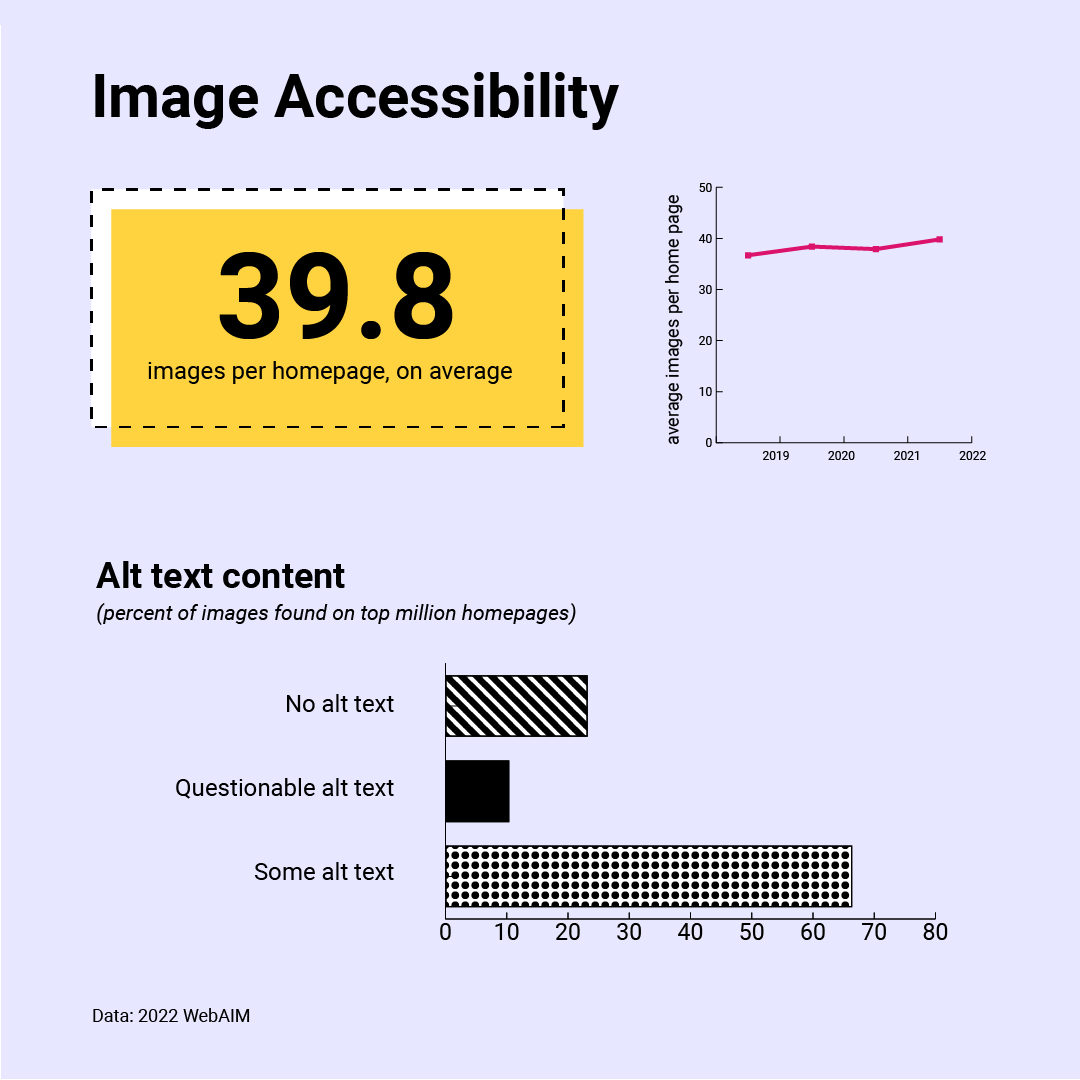
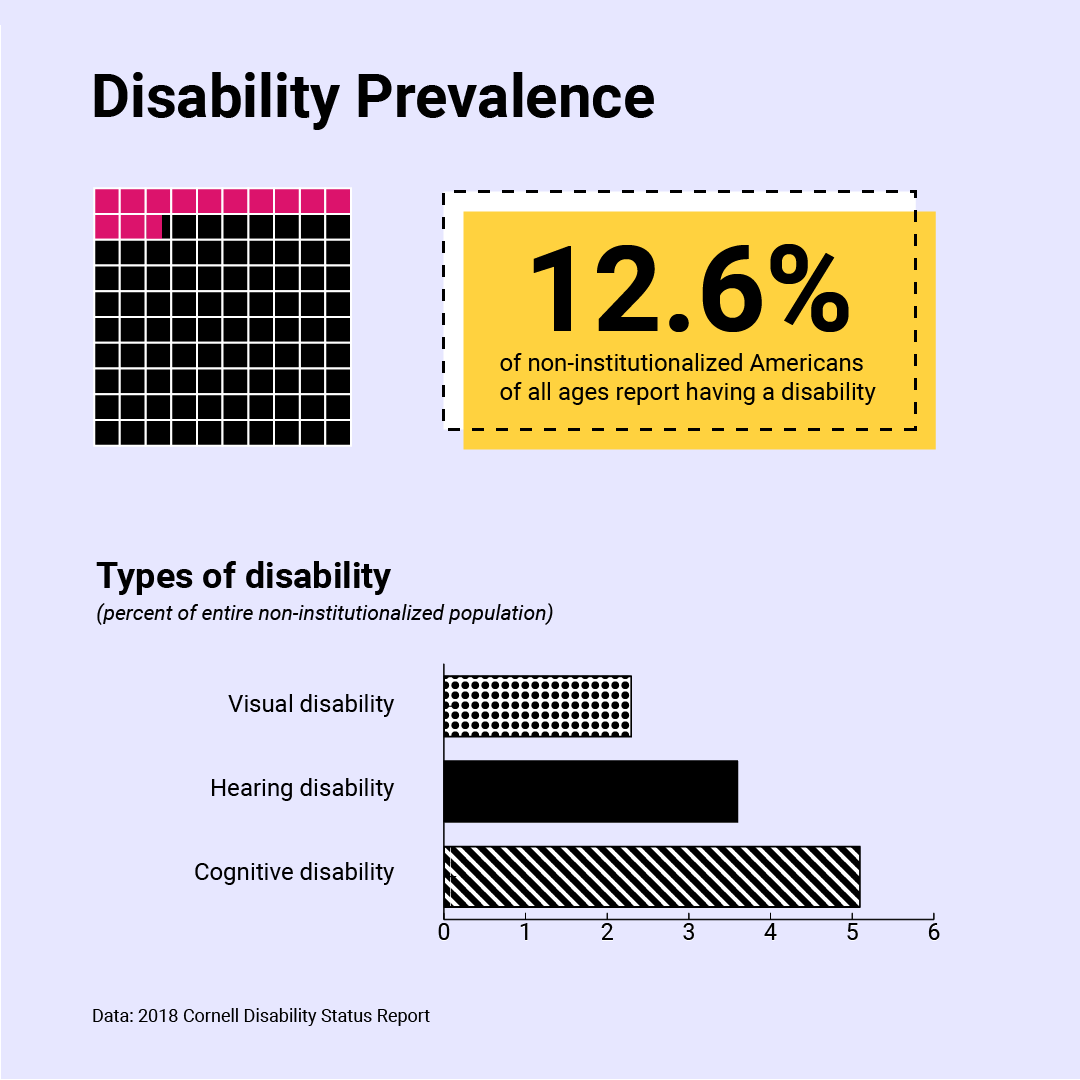
Web accessibility timeline: 1972 Rehabilitation Act, 1982: First mass-produced Braille display, 1996: First Screen Reader, 1990: ADA, 1996: DOJ considers websites public accomodations, 1998: Section 508 amended, 1999: WCAG 1.0, 2008 WCAG 2.0, 2018: WCAG 2.1, DOJ declines to offer more specific criteria, 2019: SCOTUS declines to hear Domino's case 96.8% of the homepages of the top million homepages had wcag 2 errors. Over 80% had low contrast text, around 50% were missing image alt text, around 50% had empty links, around 50% were missing form input labels, around 30% had empty buttons, and about 20% were missing the document language. Over 8,000 accessibility lawsuits between 2017 and 2020, 1/5 of ADA Title III filings are web/app accessibility lawsuits. 85% of cases come from CA, NY, FL. Districts 3, 9, and 11 have ruled that the ADA applies to physical spaces only and Districts 1, 2, and 7 have ruled that it applies regardless of connection to physical space 75.1% of screen reader users find PDFs likely to pose accessibility issues, while only 30.9% find Word docs likely to pose accessibility issues. Users vastly prefer Word docs over PDFs or EPUBs. Image accessibility: 39.8 images per home page, on average, and these are slowly increasing. Less than 70% of these images have alt text. Disability Prevalence: 12.6% of non-institutionalized Americans of all ages report having a disability. Around 2% have a visual disability, around 3.5% have a hearing disability, and around 5% have a cognitive disability.