AAPI Population Infographics

Mayor's Office on Asian and Pacific Islander Affairs

Objective: Create two graphics about DC's AAPI population: a map of the AAPI population by ward and an infographic demonstrating demographic, employment, education, and language data, for internal use within the Mayor's Office.

Deliverables: PDF, JPEGs

Process: Vectorize map, create charts using graph tool and pen tool, layout, creating and adding decorative icons.

Tools: Adobe Illustrator

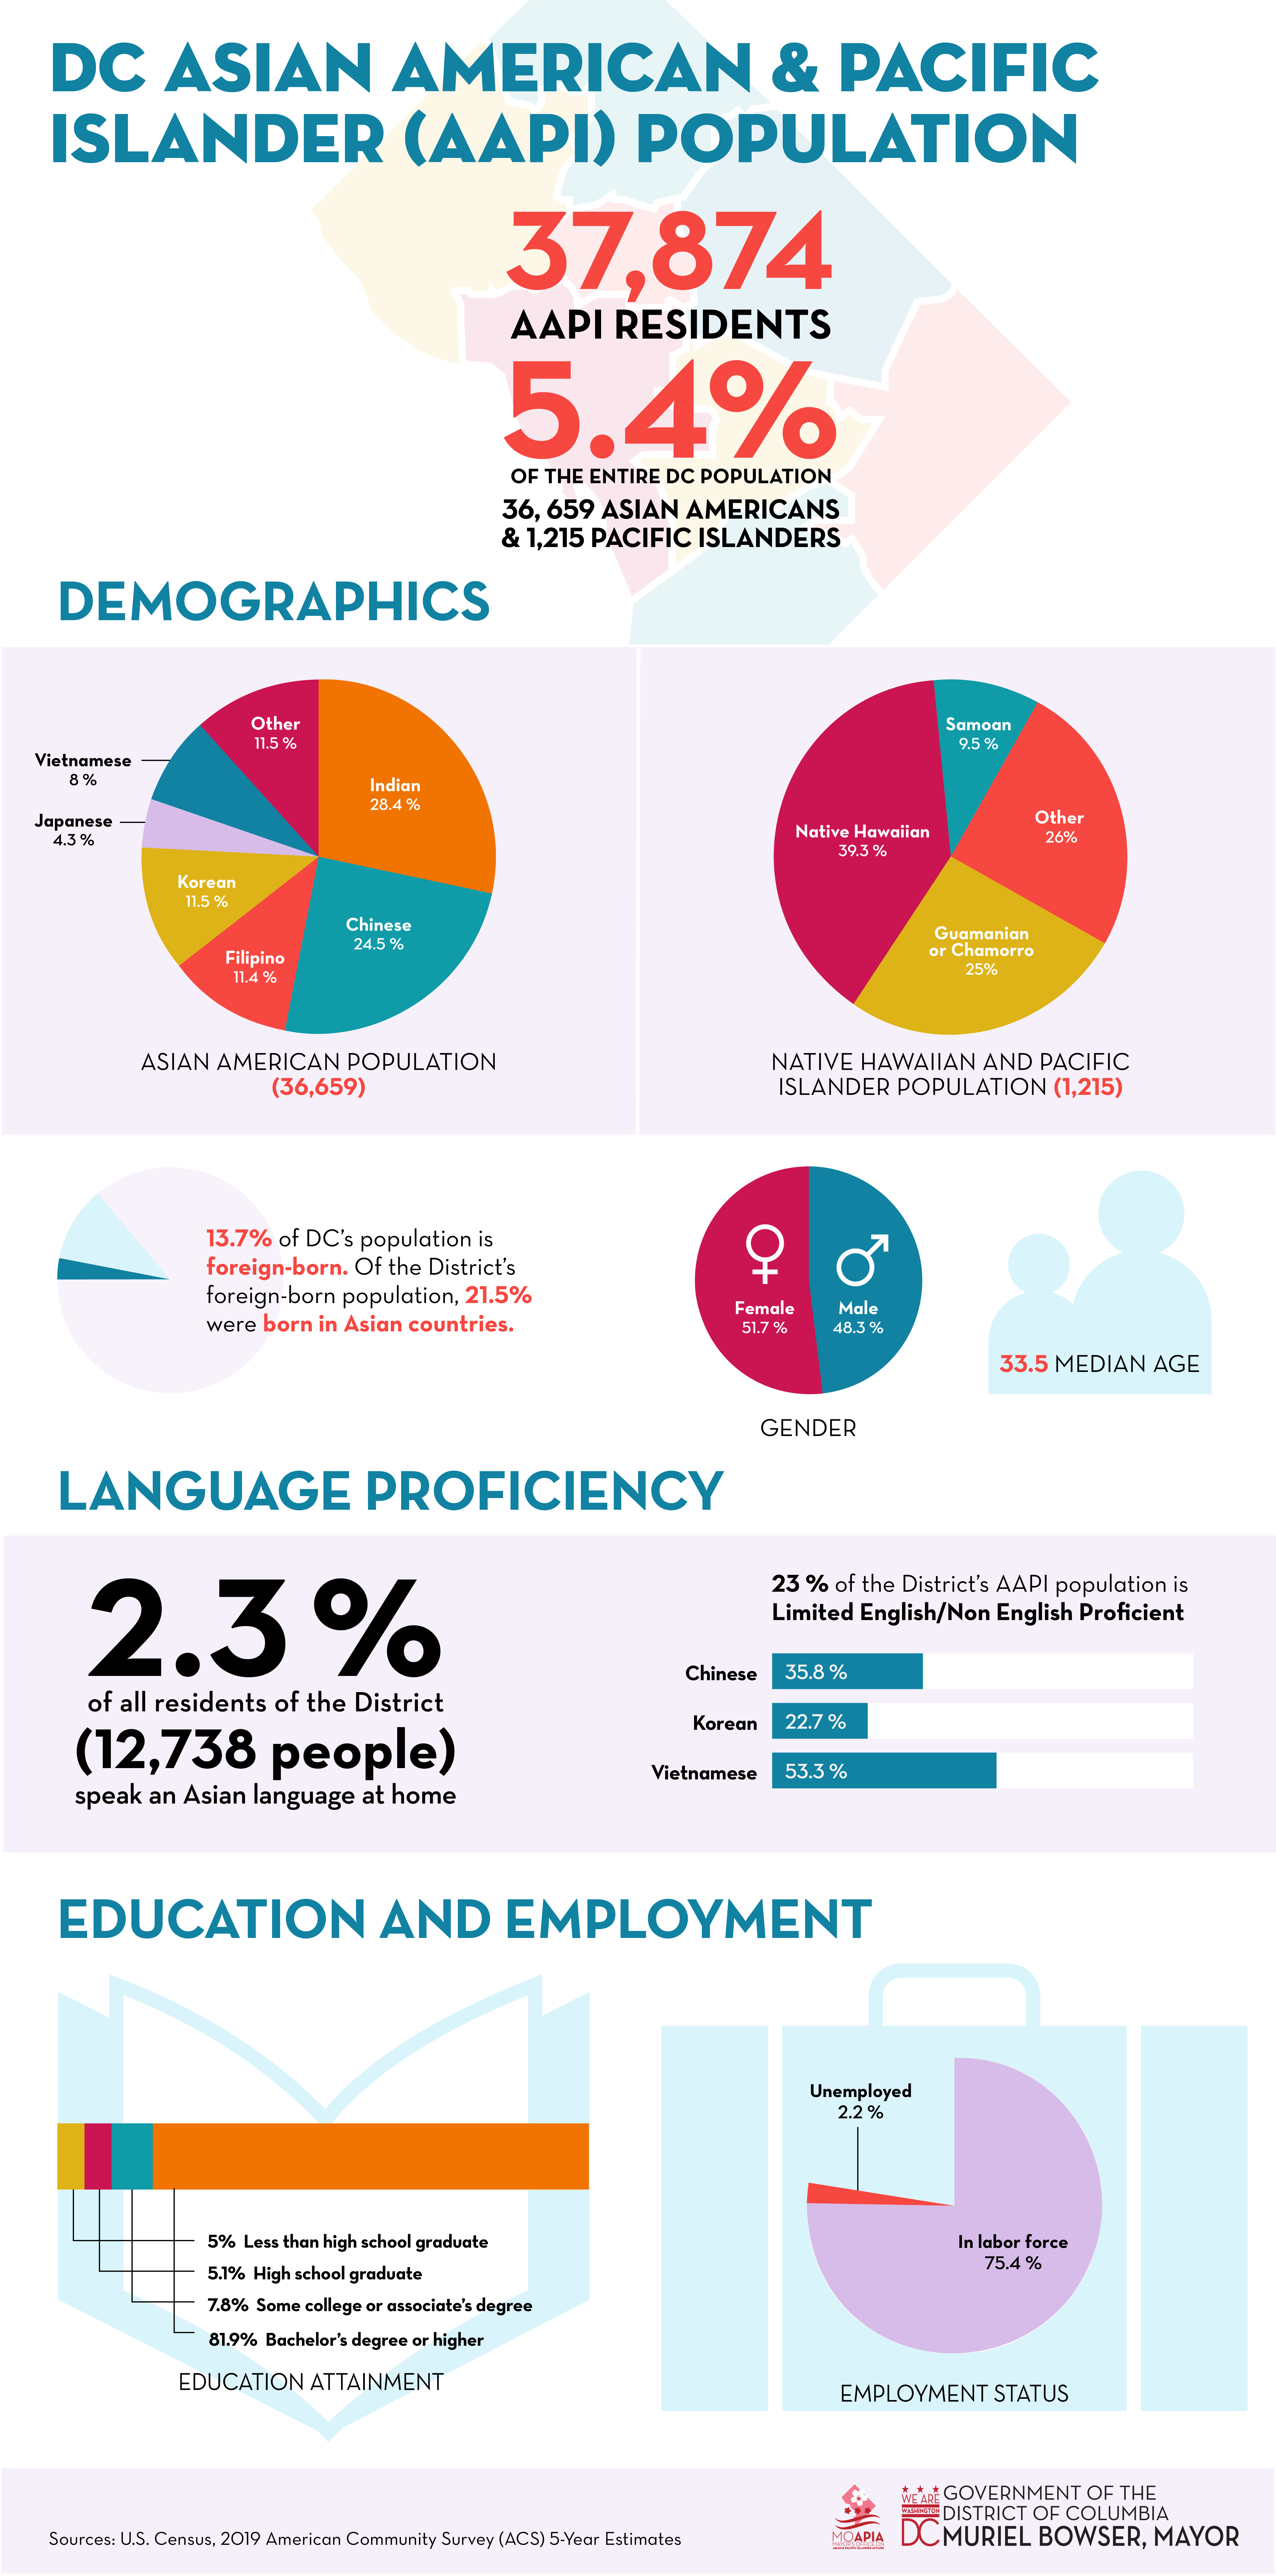
Asian American and Pacific Islander (AAPI) Population: 37,874 (36, 659 Asian Americans + 1,215 Native Hawaiians and Pacific Islanders), about 5.4% of the entire DC population.
Ethnicity of the District’s Asian American population:
Asian Indian – 28.4 %
Chinese – 24.5 %
Filipino – 11.4 %
Korean – 11.5 %
Japanese – 4.3 %
Vietnamese – 8 %
Other Asian – 11.5 %

Ethnicity of the District’s Native Hawaiian and Pacific Islander population:
Native Hawaiian – 39.3 %
Samoan - 9.5 %
Guamanian or Chamorro – 25 %
Other Pacific Islander - 26%

Foreign born: 13.7 % of the District’s population are foreign born. Of the District’s foreign born population, 21.5 % were born in Asia.

Language proficiency:
2.3%  of the District’s population speaks Asian and Pacific Islander languages at home.
23 % of the District’s AAPI population is Limited English/Non English Proficient (LEP/NEP).
The LEP/NEP percentage within the Asian American population:
Chinese: 35.8 %
Korean: 22.7 %
Vietnamese: 53.3%

Education attainment:
Less than high school graduate: 5 %
High school graduate: 5.1 %
Some college or associate’s degree: 7.8 %
Bachelor’s degree or higher: 81.9 %

Employment status
In labor force: 75.4 %
Unemployed: 2.2 %

Median age: 33.5

Gender:
Male: 48.3 %
Female: 51.7%
AAPI Population per Ward:
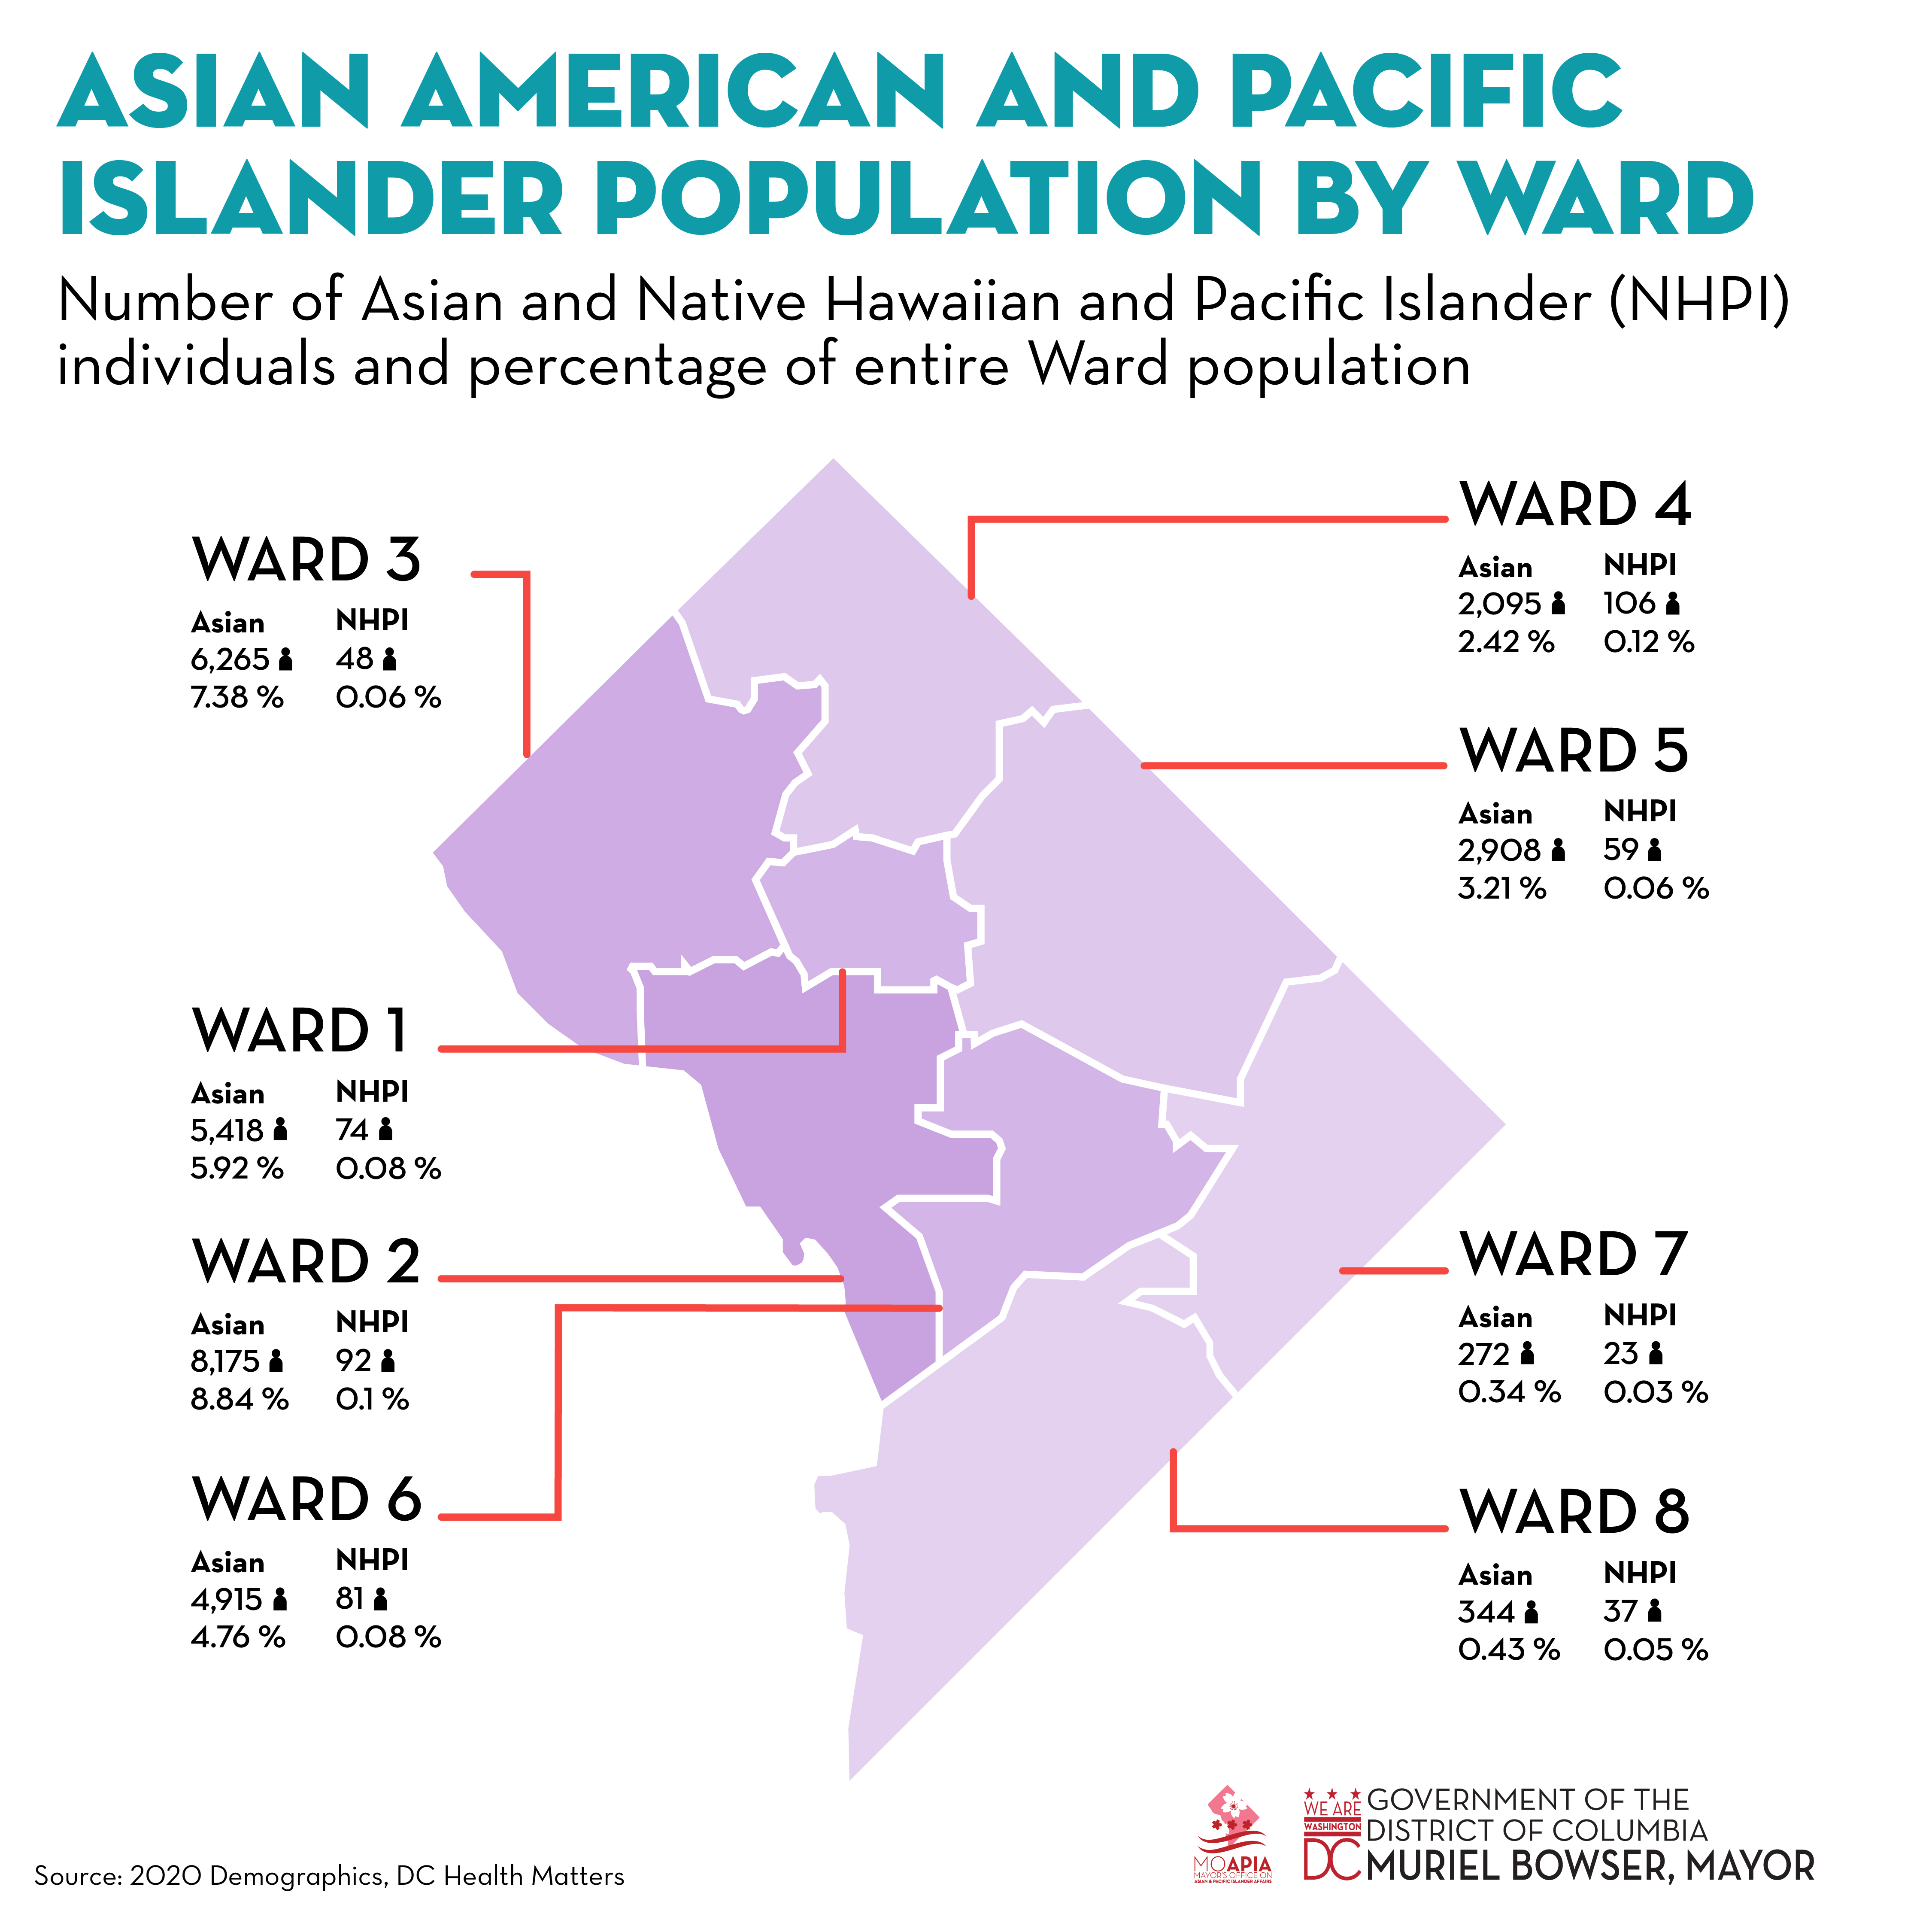
Ward 1: Asian: 5,418 (5.92% of the entire Ward population), Native Hawaiian and Pacific Islander (NHPI): 74 (0.08% of the entire Ward population)
Ward 2: Asian: 8,175 (8.84%), NHPI: 92 (0.1%)
Ward 3: Asian: 6,265 (7.38%), NHPI: 48 (0.06%)
Ward 4: Asian: 2,095 (2.42%) NHPI: 106 (0.12%)
Ward 5: Asian: 2,908 (3.21%) NHPI: 59 (0.06%)
Ward 6: Asian: 4,915 (4.76%) NHPI: 81 (0.08%)
Ward 7: Asian: 272 (0.34%) NHPI: 23 (0.03%)
Ward 8: Asian: 344 (0.43%), NHPI: 37 (0.05%)